
Adding a Data Visualization to HTML Opens Up Your Reporting Capabilities
This post shows how to add a data visualization to any HTML webpage. By adding a script reference and a data array to the <head>, you can create stunning visuals of data using all types of chart options.
Using this code from an example on Google Charts developers page, you simply add the script reference to the <head> of an HTML page. The function to store the data array of the chart or table is embedded into the header, and later shown via an embed HTML element.
<script type="text/javascript" src="https://www.gstatic.com/charts/loader.js"></script>
<script type="text/javascript">
google.charts.load('current', {'packages':['corechart']});
google.charts.setOnLoadCallback(drawChart);
function drawChart() {
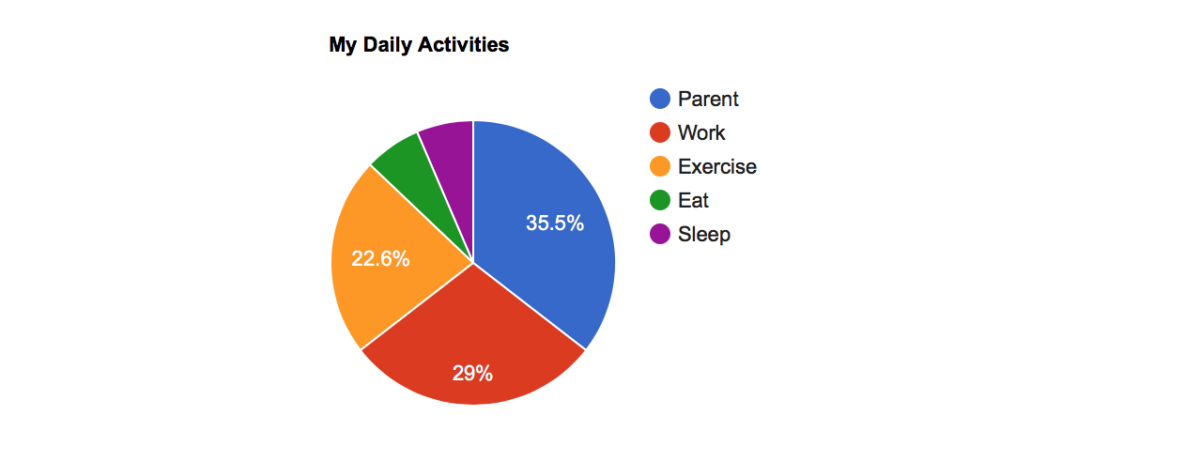
var data = google.visualization.arrayToDataTable([
['Task', 'Hours per Day'],
['Parent', 11],
['Work', 9],
['Exercise', 7],
['Eat', 2],
['Sleep', 2]
]);
var options = {
title: 'My Daily Activities'
};
var chart = new google.visualization.PieChart(document.getElementById('piechart'));
chart.draw(data, options);
}
</script>
Adding the Chart to a Page
Add the HTML snippet added to the body content where you want the chart to be shown.
<div id="piechart" style="width: 400px; height: 300px;"></div>
When the page loads, the chart will populate with the data references from the initial function.
You can explore more chart options and visualization tools using Google Developer APIs.
Peter