Google Data Studio allows you to create customized calculated fields to endlessly manipulate data in reports.
Google has released Google Data Studio, a powerful tool for combining data from different sources with endless options for visualizing and manipulating data in reports.
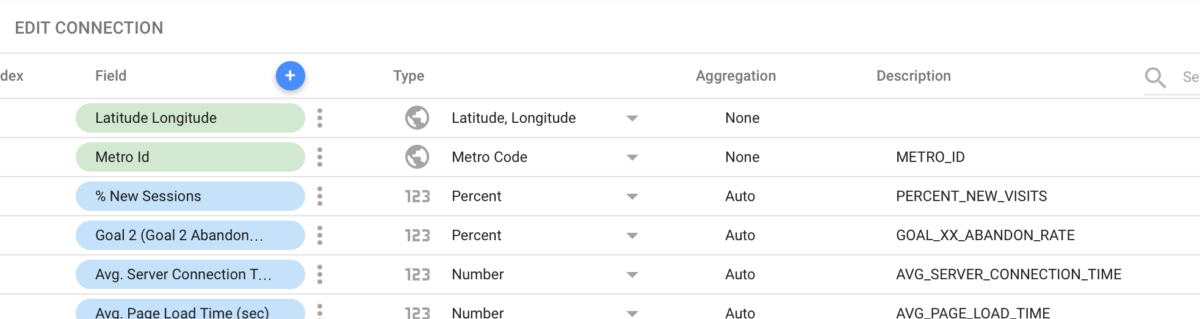
In this post, I explain how to create customized calculated fields that can be used in Data Studio reports. Calculated fields appear as objects in the data source, and can be added to charts, filters and controls in the report interface. A calculated field can even be used as a formula reference in another calculated field.
Continue reading “Google Data Studio: An Introduction to Custom Defined Calculated Fields”